
Why Posting Consistently Expands Your Reach: What 90 Days of Data Shows
TL;DR
- Over 90 days, impressions reached 342,667, up 862% on the previous 90 days.
- 90% of those impressions came from outside the existing network, with 52,343 members reached.
- The numbers show wider visibility, but they cannot prove how much growth came from consistency alone.
- Choose a weekly pace you can keep, compare equal periods, and track enquiries alongside reach.
What Is This? (Short Answer)
This is a look at why consistency matters on social media, using real analytics from a steady posting habit.
It explains what the numbers mean, what they don’t, and how UK businesses can build a manageable weekly video routine.
Alex from LPV Agency asked a simple question: consistency, and why does it matter?
The answer starts with the data, then moves to what any business can practically do with it.
The 90-Day View: Growth Beyond Your Network
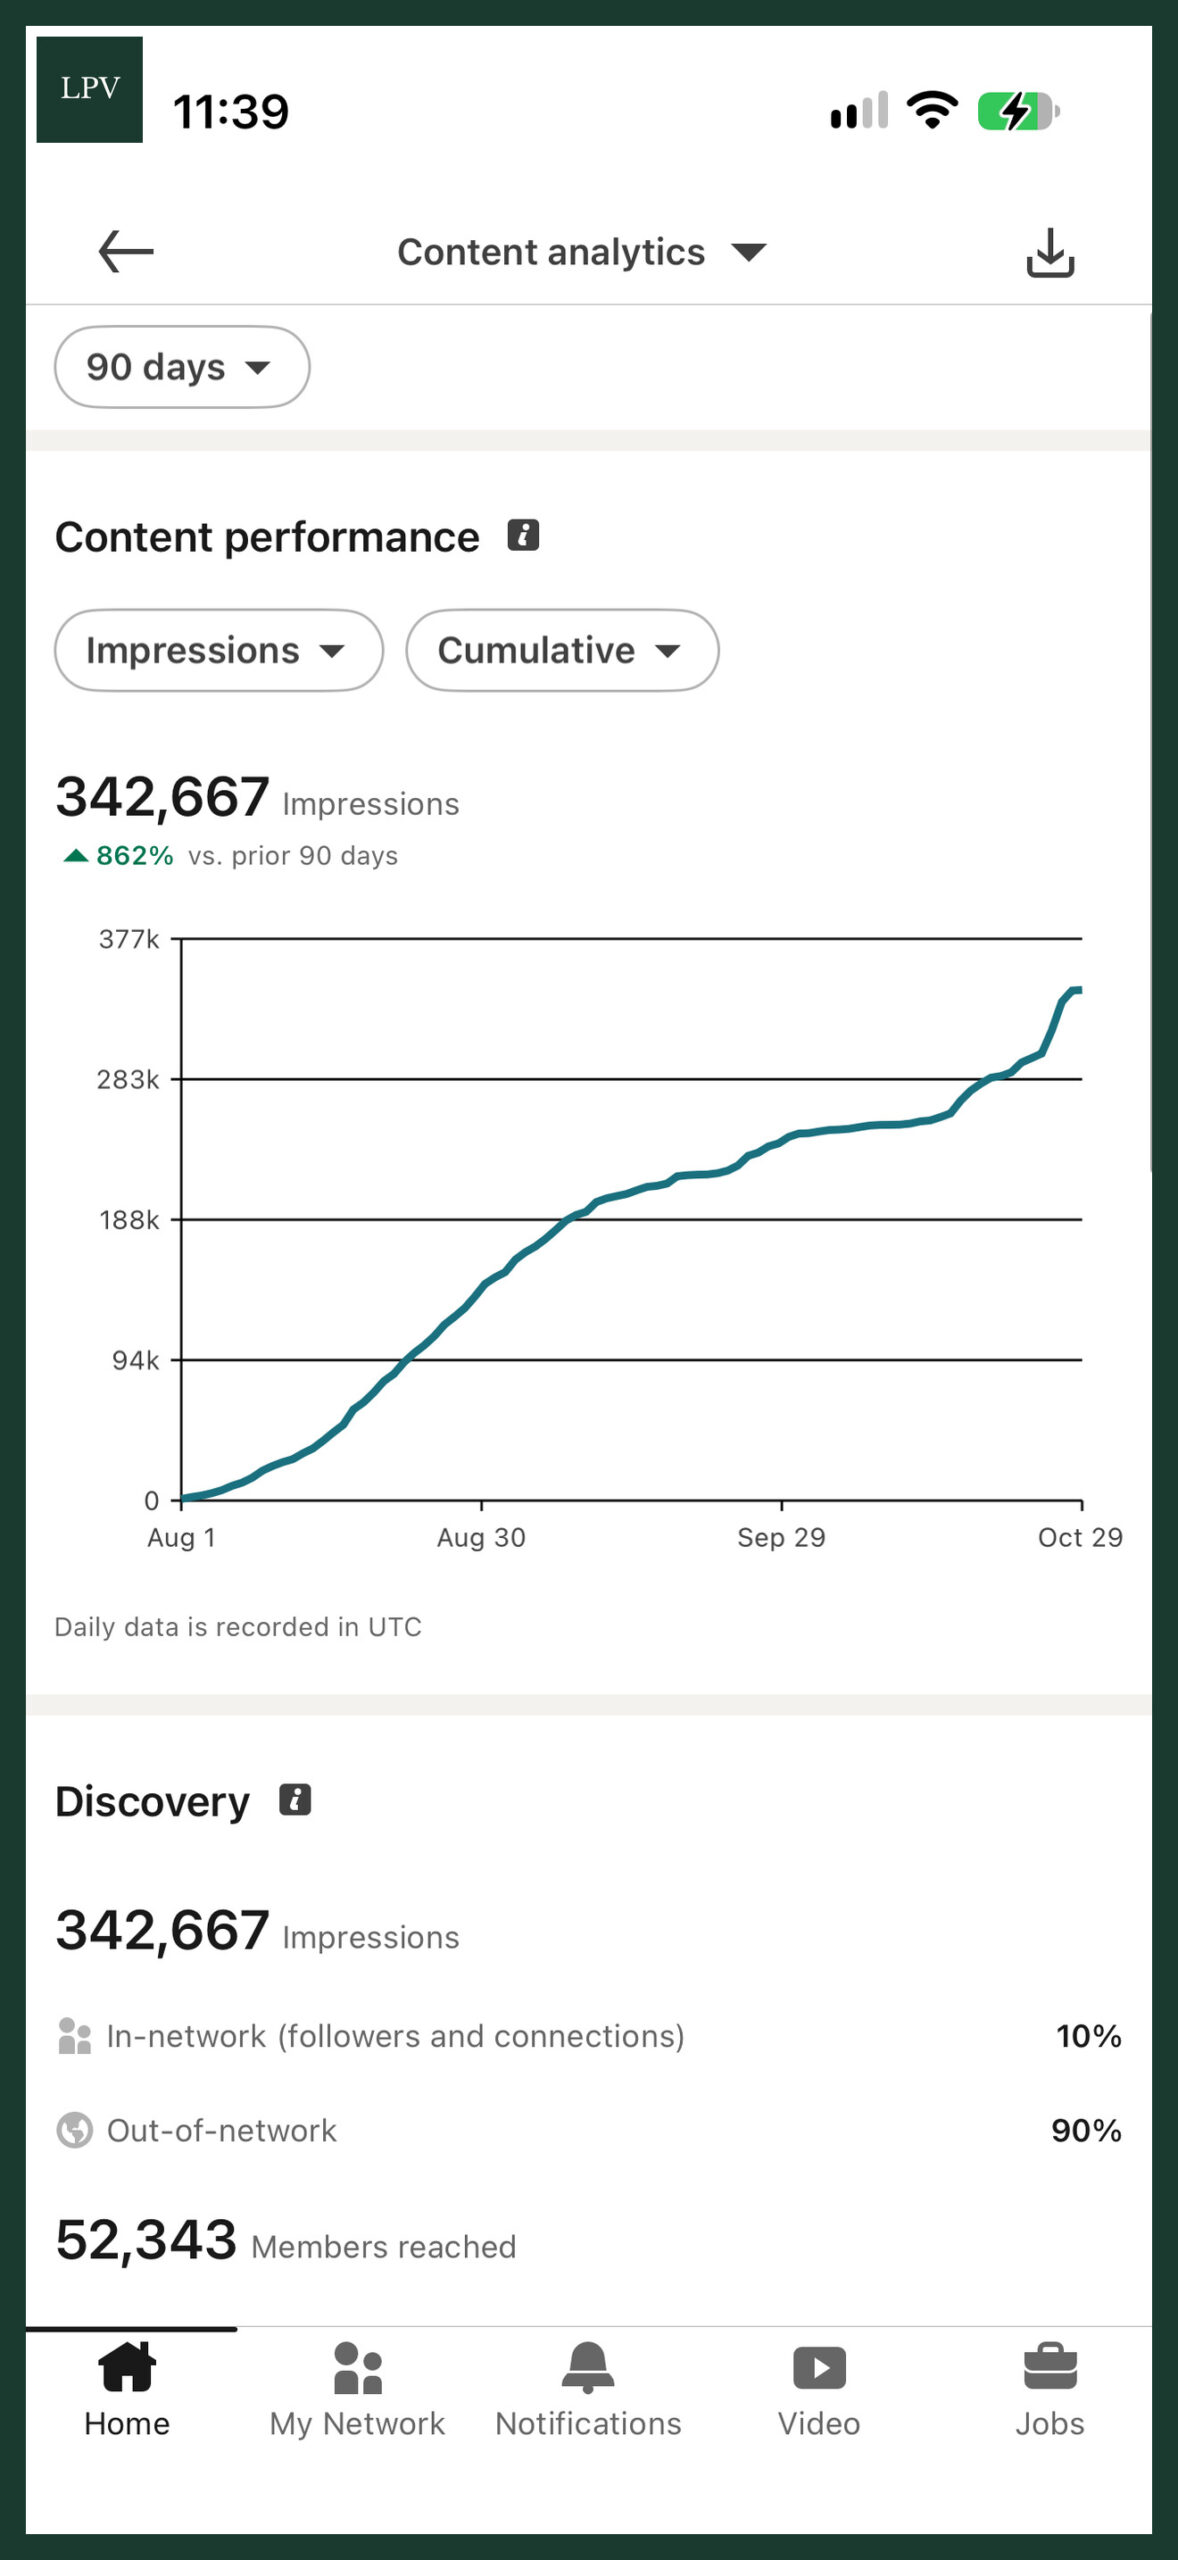
The 90-day dashboard shows 342,667 impressions, an 862% increase on the previous 90 days.
The cumulative graph climbs steadily rather than spiking once, which is what a regular posting rhythm tends to look like.
Most striking: 90% of impressions came from people outside the account’s network, with 52,343 members reached overall.
For professionals focused on authority building, that means new people are discovering your expertise, not just existing contacts.

Content analytics dashboard showing 342,667 impressions over 90 days, up 862%, from video marketing for UK businesses.
The Seven-Day View: Momentum Week to Week
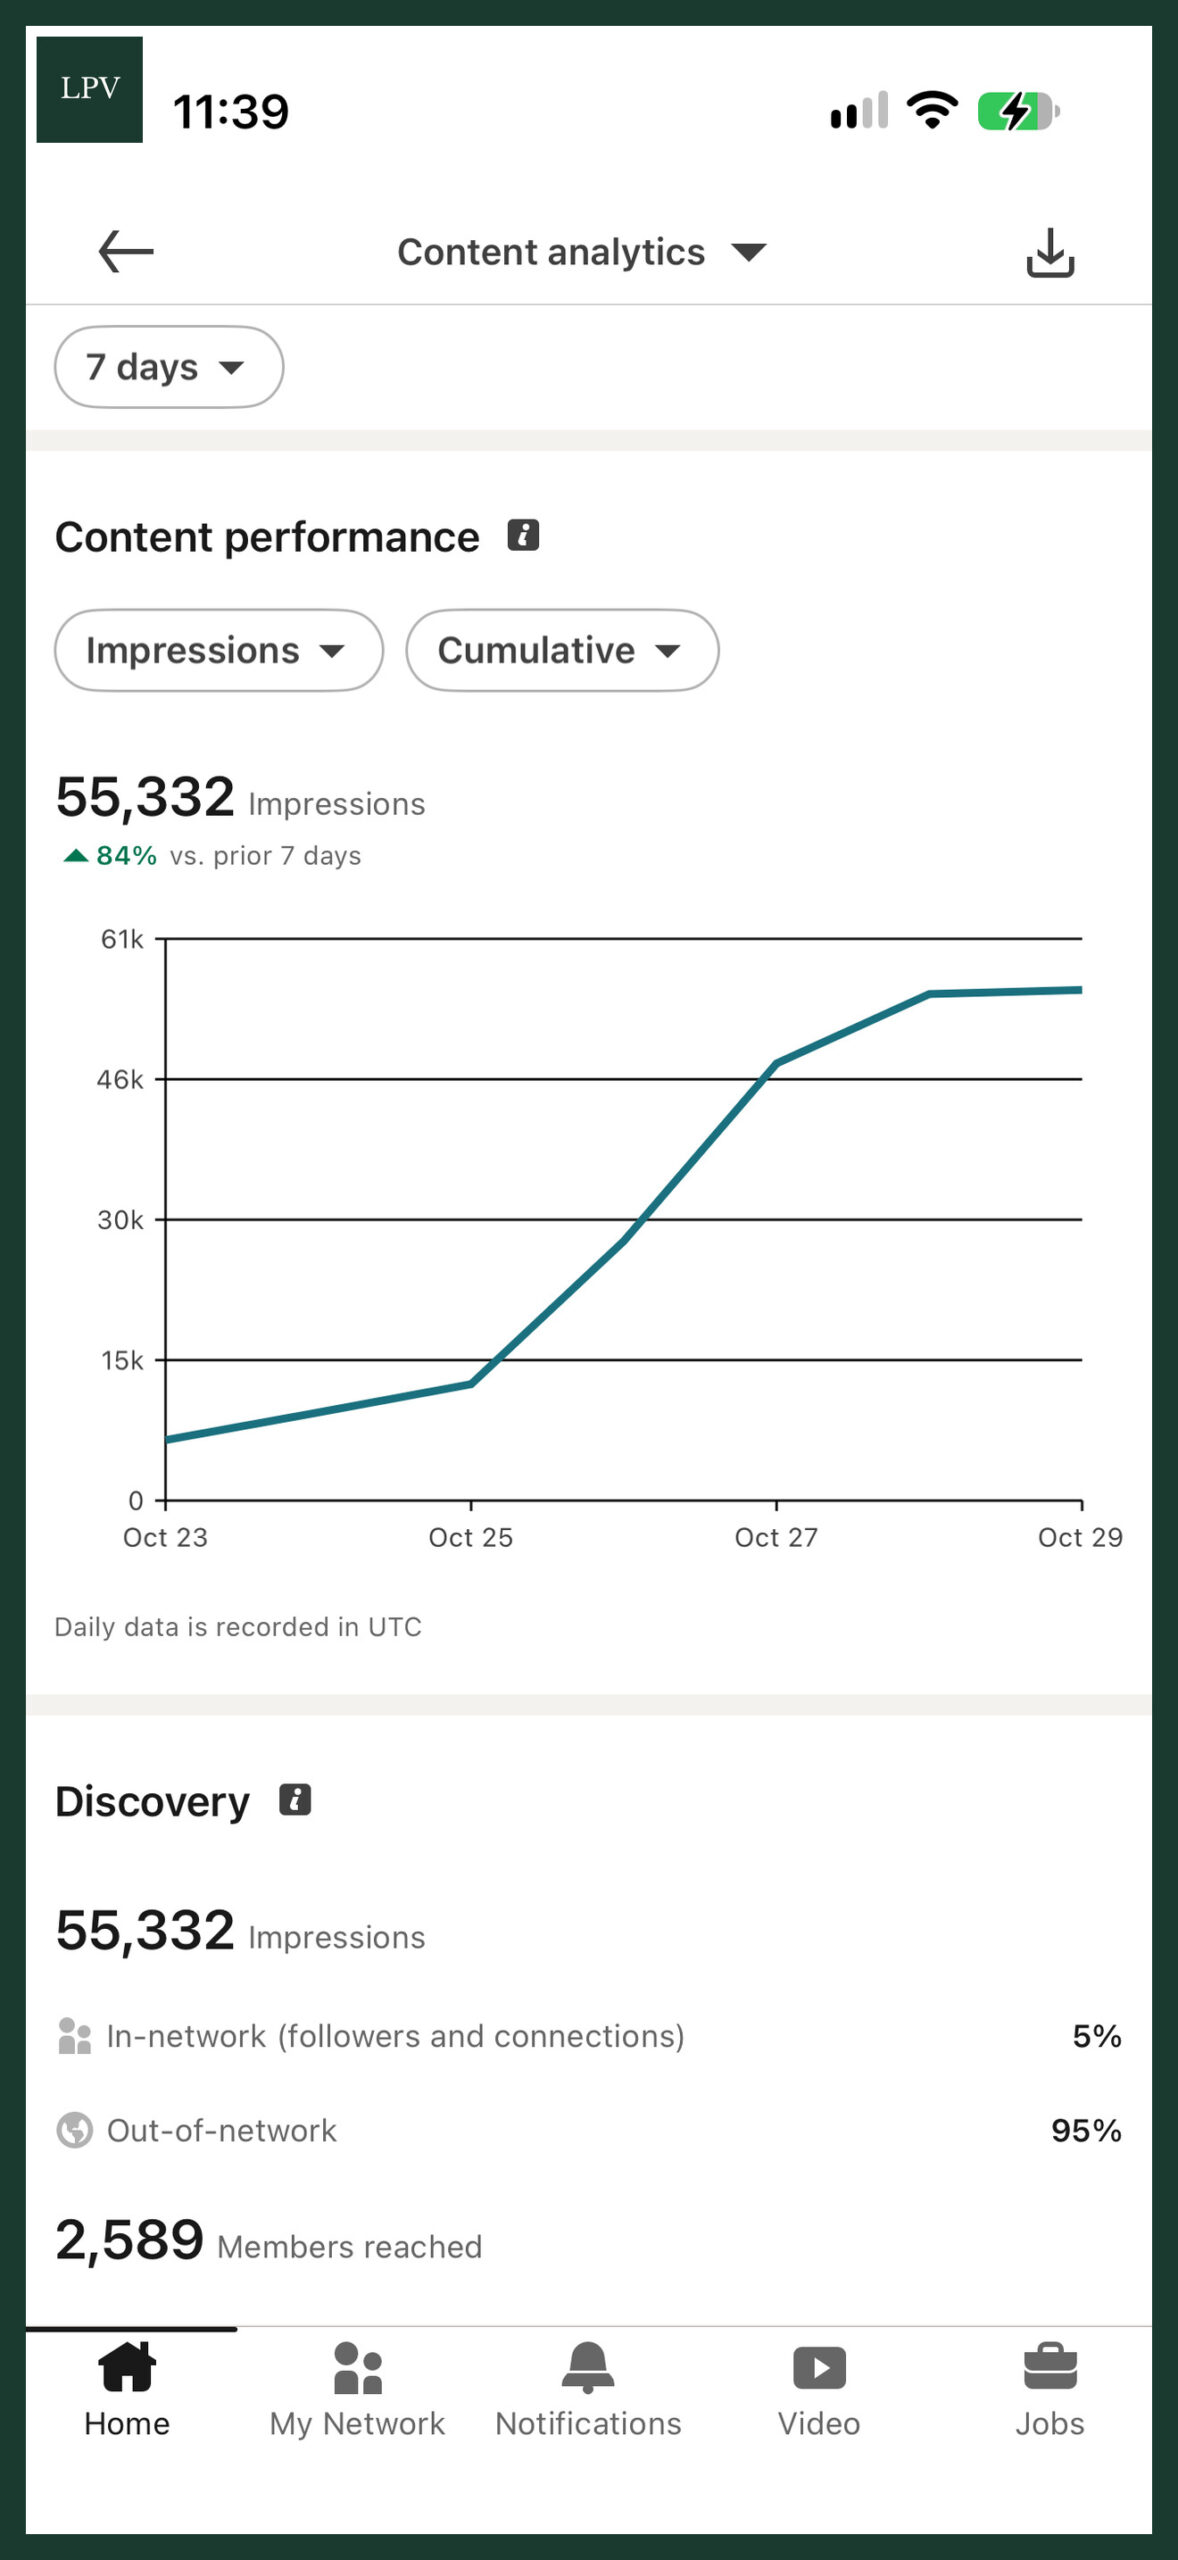
The shorter window tells a similar story: 55,332 impressions, up 84% on the week before.
Here, 95% came from outside the network, and 2,589 members were reached.
The weekly view helps you spot whether momentum is holding between posts.
Seven-day analytics showing 55,332 impressions, up 84%, with 95% from outside the network.
Impressions vs Members Reached: Reading the Numbers Honestly
Impressions can include repeat views, so one person may count several times.
Members reached gives a clearer sense of real audience size.
These figures show wider visibility, but they cannot tell us how much of that growth came from consistency alone.
Platform changes, topic choice and timing all play a part, so treat the numbers as a signal, not proof.
Analytics comparison highlighting the difference between impressions and members reached.
How does this work?
A weekly post gives people another chance to see how you work and what you know.
A short video answering a real client question gives you something genuinely useful to share each week.
Over time, those repeated touchpoints build familiarity and trust.
Who is this for?
It suits UK businesses in London, Romford, Harold Wood and beyond who know marketing matters but don’t enjoy doing it.
It’s especially relevant for professionals who want B2B visibility without spending hours on content.
What does it cost?
The main cost of doing it yourself is time: ideas, filming, editing and posting every single week.
With LPV Agency’s ClientWorkSystem, your commitment drops to two minutes of recording, and the system handles ideas, editing, posting and consistency for you.
What are the risks?
- Assuming reach equals revenue without tracking enquiries.
- Choosing a pace you can’t sustain, then stopping entirely.
- Comparing unequal time periods and drawing the wrong conclusions.
Key Takeaways
- Steady posting coincided with an 862% rise in 90-day impressions.
- Most visibility came from outside the existing network.
- Members reached is a more reliable audience measure than impressions.
- Data shows visibility, not proof of cause, so measure carefully.
- Short videos answering real client questions make consistency easier.
Implementation Checklist
- Pick a realistic pace, such as one video per week.
- List the questions clients ask you most often.
- Record a short answer to one question each week.
- Compare results over equal periods: 7 days vs 7 days, 90 vs 90.
- Track enquiries alongside reach, ideally in your CRM.
- Review monthly and adjust topics based on useful conversations.
Common Mistakes
- Posting in bursts, then going quiet for weeks.
- Celebrating impressions without checking members reached.
- Making generic content instead of answering real client questions.
- Ignoring whether attention turns into enquiries.
Consistency You Can Actually Keep
The data shows that showing up regularly can put your expertise in front of far more people than your existing network.
The hard part is keeping it going, and that’s where a done-for-you approach helps.
If you want social media on autopilot, LPV Agency’s ClientWorkSystem turns two minutes of video a week into consistent, measurable visibility. Get in touch with Alex and the LPV Agency team to start your weekly habit.
FAQ: Practical Questions People Ask
What is the fastest way to apply Why Posting Consistently Expands Your Reach: What 90 Days of Data Shows in a real business?
Start with one repeatable workflow, define the outcome, and automate only that part first. For example: The 90-day view shows 342,667 impressions, up 862% on the previous 90 days.
Of those impressions, 90% came from outside the account’s network, with 52,343 members reached overall. The seven-day view shows 55,332 impressions, up 84% on the week before, with 95% outside the network and 2,589 members reached.
Impressions can include repeat views; members reached gives a clearer sense of the audience size.
How does this approach improve consistency and trust?
It creates a repeatable publishing cadence with clearer messaging and fewer manual delays, which improves audience confidence over time.
Do small teams need expensive tools to implement this?
No. A lightweight stack can work if it covers recording, editing, scheduling, and analytics with a clear process and ownership.
What should be measured first to validate results?
Track output consistency, content completion time, and conversion indicators (qualified leads, booked calls, or sales conversations).
Why is LPV Agency focusing on this strategy?
Because it reduces execution friction while improving visibility and lead quality. The goal is practical growth, not vanity metrics.